Your stakeholders are complaining that the app is slow. You work tirelessly to shave millisecond over millisecond off your server’s response time. Yet, at the end of the month, the stakeholders still complain about the suboptimal performance, to only later discover that they are using the application on a smartphone connection, inside a building with hundreds of other people using a smartphone, and while taking the elevator to move from one meeting room to the other.
This is just a story, but maybe you have experienced (or are experiencing) something similar in the real world and are looking for a more scientific approach to performance tuning. Perhaps you are here looking for an easy solution to improve your performance by just tweaking a single parameter in your configuration.
Unfortunately, most of the time, that’s simply not possible. All the overnight success stories you read about are the result of long experimentation, and they conveniently forget to mention all the failed attempts. Performance tuning is complex: it heavily depends on your application’s context, architecture, and tech stack. To succeed, you must get your hands dirty and enter into a continuous measure/tune/verify cycle.
In this article, we will showcase a process for experimenting with the ideal performance setup for a Solidus-based eCommerce application, as well as some interesting conclusions we’ve reached.
Starting with Puma threads
When configuring a Puma-based Rails application, you can tune a lot of values to optimize its performance. Still, we can simplify our process by focusing on four major levers:
-
The number of Puma workers
-
The number of Puma threads
-
The amount of CPU in your environment
-
The amount of RAM in your environment
For now, let’s assume the amount of CPU and RAM and the number of Puma workers are constant, which is the most straightforward configuration you can have. We’ll talk about Puma workers and horizontal vs. vertical scaling in a separate article.
That means we should just focus on the number of threads, which allows us to keep things simple and straightforward. In general, when tuning performance, we recommend tweaking one parameter at a time: touching multiple levers simultaneously will lead to inconclusive results, and you might end up making things worse.
Works on my machine!
For this experiment, we have run all tests locally. This allows us to have full control over environment in which the load tests are running. It also gives the Rails server plenty of CPU and RAM, preventing those from becoming a bottleneck in our testing.
Another advantage of running the tests locally is the almost complete lack of DB latency. In the real world, DB latency might impact the ideal number of threads, since each DB request will block its originating thread for a little longer. However, you can fine-tune this parameter in production. In this case, we’re more interested in getting a ballpark number that we can start with.
The setup
In this experiment, we will optimize a Solidus-based eCommerce application, running PostgreSQL and Redis for data storage and caching/background jobs.
We’re using k6.io for load-testing because the open-source version is free, easy to set up and use, and it’s scriptable.
As a first step, let’s bootstrap a simple Solidus store. We won’t go through the setup because the process is already covered in the official Solidus documentation. You can find all the code in the GitHub repo for this post.
We wrote a k6 script that simulates a complete visit to the website and performs a guest checkout. Note that this approach has some limitations: for example, we’re not testing the authentication system. However, it’s a good approximation of what a typical user journey would look like on my store.
As recommended by k6, we’re not testing asset delivery: in production, assets will most likely be served by a CDN, so testing them in a local environment would just muddy my data. Right now, we’re only interested in optimizing the application server.
We’ve decided to load-test the system with 50 concurrent users, each completing a single journey in my application. We’ve run the script against our Solidus application ten times, progressively increasing the number of Puma threads from 1 to 10.
The results
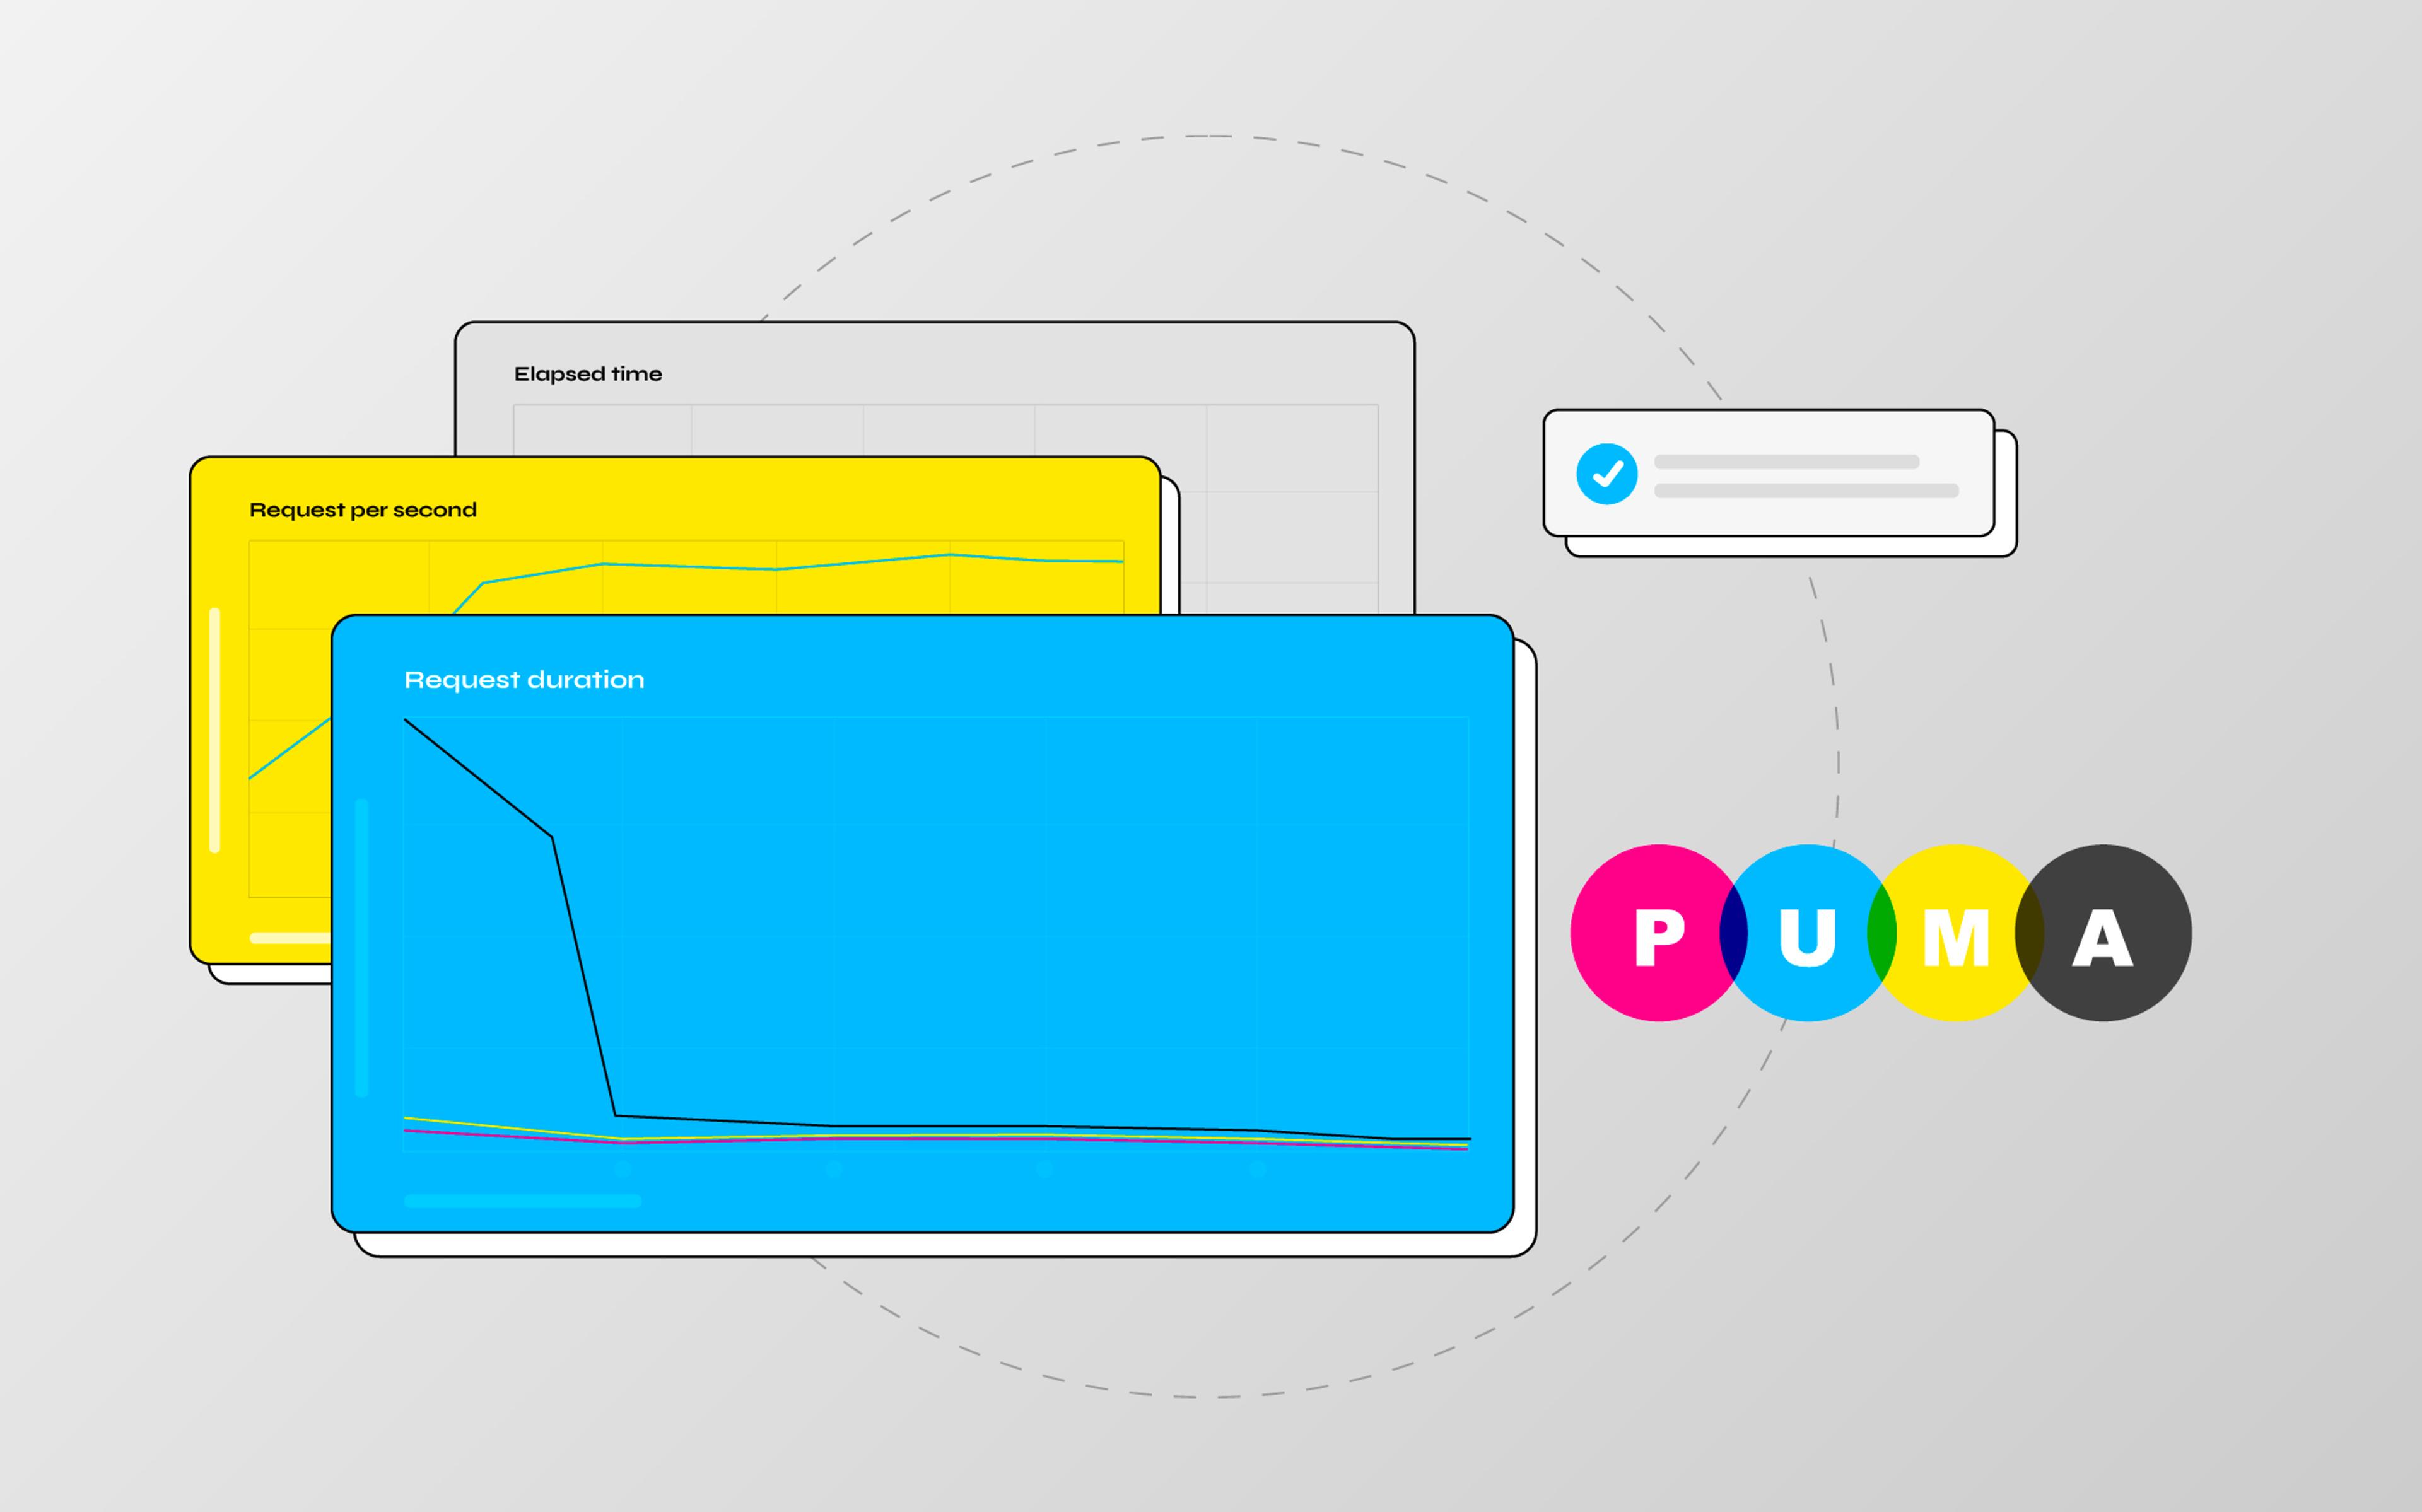
Here are some graphs showing our results:


Like most eCommerce applications, our Solidus store is a DB-heavy codebase, and it blocks each thread for a relatively long time. This is noticeable in our benchmark because the application is heavily underperforming with fewer than 4 threads.
It’s also interesting to note how the default Puma value of 5 threads is a good starting point for our application: anything beyond 5 threads is only giving us marginal gains. It also looks like performance is actually decreasing above 8 threads, which is probably due to the excessive thread context switching.
Conclusions
k6 is a powerful tool with many applications: for instance, it could be used to enforce service-level objectives through automated performance tests.
When it comes to performance tuning, it’s always a good idea to put all decisions under the microscope. It was interesting to confirm that the default value of Puma workers is indeed a sane default. For a Solidus store, I would probably recommend bumping that number to 8 as a starting point to squeeze out each bit of performance.
However, the number of Puma threads is just the beginning. For instance, in a real-world performance tuning project, we should also:
-
Calculate the amount of RAM I need to accommodate my ideal number of threads.
-
Experiment with the number of Puma workers with 1 CPU.
-
Experiment with the advantages of having a dedicated CPU versus a shared one.
-
Compare different PaaS solutions to evaluate the pricing of our ideal setup.
-
Experiment with horizontal and vertical scaling for our needs, creating to a well-defined scaling strategy.
As we’ve mentioned in the introduction to this article, there is no silver bullet for performance tuning: each project needs to account for the context, technical and business factors at play. However, by adopting a rigorous, scientific approach, you can tame the usual chaos of performance tuning, reaching your desired results with much less effort.
Over the next few weeks, we’ll continue to expand on this topic. Stay tuned!