
In the first two posts of our series on Experience-Led Commerce, we laid the foundation for why customer experience (CX) is one of the most powerful (and most underutilized) levers for sustainable e-commerce growth.
We saw that in an environment of rising acquisition costs and changing consumer behaviors, brands that invest in customer experience can outperform their peers across virtually every metric: lower CAC, higher LTV, and improved conversion rates. We introduced Experience-Led Commerce (XLC) as a structured approach to making that investment count.
We also explored how customer experience spans three dimensions: when, where, and why customers interact with your brand. Combined together, these three angles provide a clearer and more actionable framework than traditional customer personas.
But with the foundation laid out, we are now faced with a critical question: where should you start if you want to start investing into your brand’s customer experience? With today’s “messy middle,” so many touchpoints to optimize, and so many technologies to adopt, even the most sophisticated brand operators can end up feeling overwhelmed, which can lead to bad investments or analysis paralysis.
This article is our answer to that conundrum. We’ll outline the exact process we follow at Nebulab to go from unstructured data to structured insights to prioritized opportunities. By the end of the article, you’ll have a modular framework that you can easily replicate for your own brand based on your resources and level of maturity.
Without further ado, let’s take a look!
Step 1: Collect the Right Data
To improve your customer experience, you first need to understand what it looks like today—not just in theory, but in the messy, real-world interactions your customers have with your brand across channels, platforms, and moments in time.
As you may imagine, this understanding can only come from data, both qualitative and quantitative. By continuously collecting and analyzing data about the state of your customer experience, you can start forming a picture of the state of play.
The data that we typically collect during a CX audit includes:
- Anecdotes: Strategic priorities, internal assumptions, and departmental pain points. The stuff that your gut tells you to be right. For some organizations, this is unfortunately the only data source that matters. Others will scoff at this in favor of a pure-play data-driven methodology. We think neither approach is correct, and we’ll see why in a second.
- Expert heuristics: UX/UI audits, competitor benchmarking, and other heuristic reviews to spot points of strengths, points of friction and gaps in your customer experience. Baymard is the state of the art when it comes to e-commerce UX. We rely on their library extensively, but we also combine it with our own expertise and the client’s business/operational context.
- Market research: Consumer confidence trends, macroeconomic factors, pricing sensitivity, and industry forecasts. These will give you an idea of what consumers are looking for, what trends to ride and what ships to abandon. At the same time, you should be mindful that market research can only give you a map, and the map is not the territory.
- Voice of the customer: As the name suggests, this is quite literally what your customers are telling you about your brand and experience. Customer interviews, first- and third-party product reviews, on-site surveys, social media comments all fall under this category. However, you should know that people will often lie about their intentions and desires, even when they don’t realize they’re doing so.
- Behavioral analytics: Not what your customers are saying, but rather what they’re doing. This includes funnel analytics, session replays, heatmaps, return rates and reasons, and the results of your A/B test experiments. While more reliable, behavioral analytics are inherently partial (they tell you what, not why) and backwards-looking (they analyze the past and cannot predict the future).
One common pitfall you may run into here is to go too deep on one data source at the expense of all the others: collecting one year of customer reviews may not be as important as collecting the latest three months of customer reviews and pairing those with quantitative data about the return rates and return reasons of different product categories. This is one of those cases where variety matters more than volume.
Furthermore, data has an expiration date. Market research from two years ago may be generally interesting, but it’s likely the economy and your industry have shifted significantly since that report was produced. This means that going too deep on one data source isn’t just useless: it can actually be counterproductive by polluting your data set.
This may sound hard already, but collecting data is actually the easy part. The real challenge lies in making sense of it.
Step 2: Turn Data Into Insights
The second step in your data-driven journey is synthesis. This is where you look at the data and start poking at it to answer questions such as:
- Where do stakeholder perceptions align (or not) with customer sentiment?
- Which complaints show up in product reviews, focus groups, and support tickets?
- Where are users dropping off in the funnel, and what are they saying when they do?
Good synthesis is more art than science, and it requires both pattern recognition and critical thinking. It involves looking for friction and flow—moments that either propel users forward or send them backward. With one client, for instance, we observed that users were often confused by the site's taxonomy. This friction was surfaced in the UX audit, confirmed in session replays and bounce rates, and ultimately traced back to a lack of backend tagging standards that also hampered merchandising and CRM—something that was lamented in stakeholder interviews.
Artificial intelligence can be a powerful ally in this phase, especially when you're dealing with large, complex datasets:
- For qualitative data, AI can cluster open-ended responses, extract sentiment trends from hundreds of reviews, or summarize transcripts into digestible themes.
- For quantitative data, it can automatically flag anomalies in metrics, identify statistically significant shifts in conversion rates, or correlate changes in performance with external factors like promotions, ad spend, or inventory levels.
Used well, AI helps you explore multiple hypotheses quickly, highlight non-obvious connections, and surface the signals buried in the noise. What it shouldn’t do is replace human interpretation. Think of it as an accelerator—it helps you go faster, see broader patterns, and zoom in on what matters, all so you can focus on decisions, not data wrangling.
Here are a few example prompts you might use to synthesize insights:
- "What are the top 3 recurring complaints in these reviews?"
- "Summarize this interview transcript by theme and tone."
- "Group these support tickets into top 5 issue types with example quotes."
- "Highlight any statistically significant drop-offs in this conversion funnel."
- "Which campaigns had the highest impact on AOV last quarter?"
When running audits, we follow a battle-tested AI-assisted workflow that involves progressive summarization and distillation of the data:
- We store the raw data from each data source in an internal database.
- We ask the AI to summarize the key insights from each datapoint.
- We ask the AI to further cluster the summaries by each data source.
- Finally, we use the AI to produce a single executive summary.
At every step, we store the AI’s output as its own artifact, which allows us to either drill down into the individual datapoint or get the ten-thousand foot view by reading the executive summary, which helps us have informed discussions for different purposes and at different levels of granularity. It also allows us to find areas of alignment and contradictions between datapoints or data sources (more on how to handle these in the paragraphs below), which helps us validate the integrity, quality and thoroughness of our research.
By this stage, you should have an executive summary that clearly outlines the state of your current customer experience from multiple different perspectives and viewpoints.
The next step is to understand what opportunities those insights open for your business.
Step 3: Turn Insights into Opportunities
This is the phase where a strategy finally begins to take shape.
At this point, you’re not just looking at what’s broken—you’re figuring out how to fix it. To do that, you need to bridge the gap between what the data tells you and what action you can take. For each insight you've uncovered, ask yourself: what can we do about this?
For example:
- If your qualitative research shows customers consistently complain about a confusing checkout flow, your opportunity is to redesign the checkout—possibly starting with small experiments like simplifying the shipping form.
- If analytics reveal a high return rate on a specific product category, the opportunity may lie in improving product detail pages, sizing information, or the product itself.
- If reviews and support tickets highlight unmet expectations around delivery timelines, the opportunity could involve improving operations or setting better expectations through copy and UI.
Each problem statement then becomes a candidate opportunity. But not every opportunity is worth tackling immediately. That’s where the ICE framework (Impact, Confidence, Effort) comes in. You should assess each opportunity by its:
- Impact: How much value could this create for your users and your business?
- Confidence: How confident are you that this change will solve the problem?
- Effort: How complex or costly is the solution?
Scoring each opportunity across these three dimensions allows you to build a prioritized backlog. Quick wins (high impact, high confidence, low effort) go to the top and will usually be executed right away. High-effort or low-confidence ideas go into your long-term roadmap.
Turning insights into opportunities is where both intuition and industry expertise become critical. Matching symptoms to solutions is not enough; you need to understand what’s really driving the friction and how it plays out in your specific context.
A DTC supplement brand notices that many customers cancel their subscription after the first month, citing “didn’t see the benefits.” A less experienced team might respond by offering deeper discounts or extending the trial period. But a closer look reveals that customers often don’t take the supplements consistently—or aren’t sure what to expect. The real opportunity is to design an onboarding flow that educates users on dosage, timing, and expected outcomes, paired with reminders and habit-building tips.
This is why cross-functional collaboration, paired with seasoned judgment, often makes the difference between good ideas and transformative ones.
But even experienced operators are not infallible, which is why we don’t just blindly roll out our solutions. Instead, we generate multiple hypotheses and validate both our assumptions about the root cause and the potential effectiveness of each solution. We do that by borrowing another concept—this time, it’s called Lean Validation.
Step 4: Execute, Measure, and Iterate
Lean Validation comes from the Lean Startup methodology, where the goal is to maximize learning while minimizing waste. Instead of committing fully to a solution, you test it as early and cheaply as possible. The aim is to understand whether the direction you’re heading in is sound and reduce the risk of spending significant resources on something that doesn’t work.
You can validate ideas leanly with:
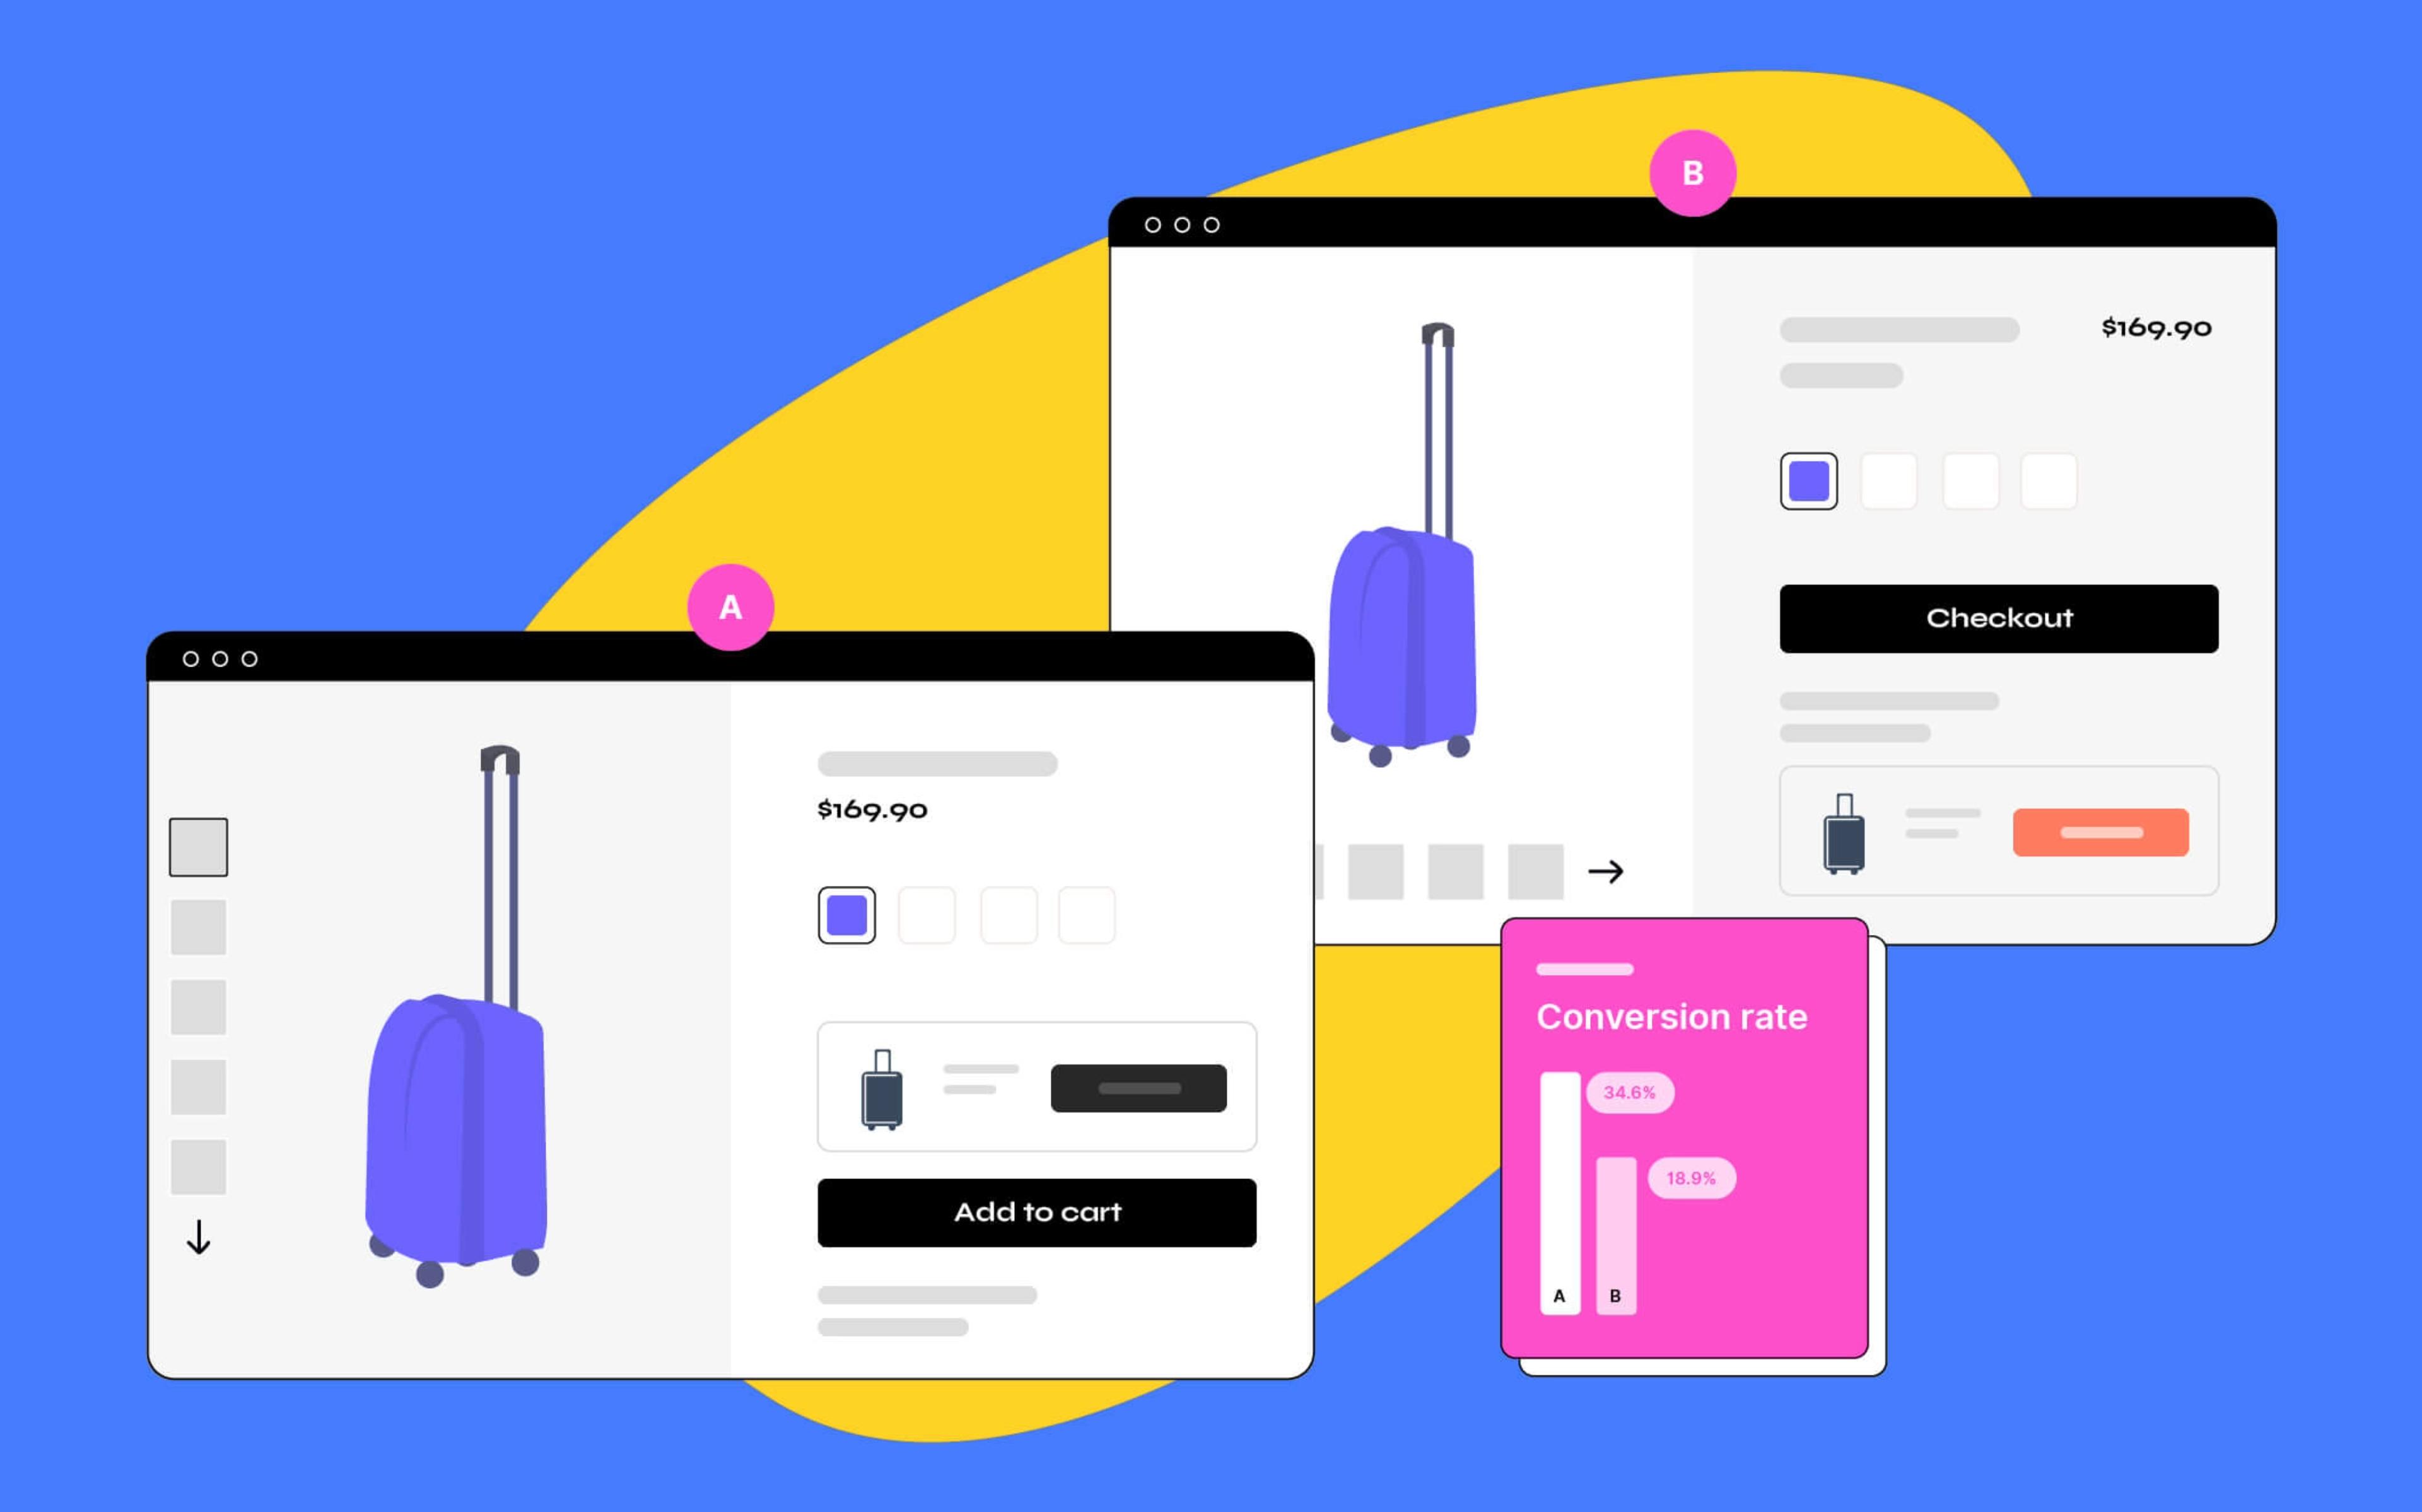
- A/B tests on key journeys
- Unmoderated user tests on wireframes or prototypes
- Email experiments or landing pages to test messaging or demand
- “Fake door” tests to gauge interest before building the full solution
- Clickable prototypes to observe usability without writing production code
If you’ve paid attention, you’ll notice that lean validation is where the loop closes: you’re effectively returning to the data collection stage, except this time your goal is not to understand the original problem, but rather to validate whether your proposed solution is effective. In technical terms, your research has now shifted from generative to evaluative. Then, equipped with more data about the validity of your solution, you can decide whether you should roll it out or go back to the drawing board and try a different approach.
To learn more about this mindset and how to operationalize it, we recommend reading our post on applying digital product management to e-commerce, where we explore how to build and evaluate solutions through rapid experimentation and continuous discovery.
Putting It All Together
Experience-Led Commerce is a playbook that helps brands move beyond discounting wars, beyond channel fragmentation, and beyond gut-feel roadmaps. It gives you the clarity to see what your customers need, the structure to act on it, and the systems to keep learning as you grow.
Now you’ve got the blueprint—one that scales with your brand as you grow. But if you want help building it out, you don’t have to do it alone. Let’s talk.